Due to the increasing focus on sustainability issues with conventional concrete-based construction methods, wood-based building methods have steadily gained attention. However, due to the low weight of building components, these wooden building methods suffer from poor sound insulation in the low-frequency range. Typically, these structures are excited by vibration or sound; their energy is transmitted throughout the building and emits low-frequency sound that disturbs building occupants. To minimize disturbance, it is necessary to accurately predict the vibration levels within these structures.
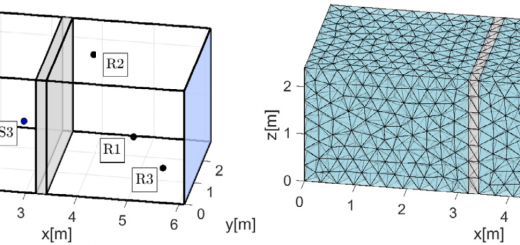
Figure. 1 Experimental setup for the scaled lightweight-wooden structure.
In our newly published study, we modelled the vibrations of buildings upon impact from an impact source using a technique known as the time domain nodal discontinuous Galerkin (DG) approach. We concentrated on a lightweight wooden floor structure composed of different components with distinct material properties (as can be seen in Fig.1). We utilized what are known as the Rankine-Hugoniot jump conditions to ensure the accuracy of our calculations. These conditions allowed us to calculate the response of the materials to the impact across the different floor components.
Additionally, we also added some damping to the model to account for energy lost through vibrations. We tested our calculations by comparing them to real-life data, and we discovered that they generally agreed, particularly with regard to the structure’s natural frequencies (see Fig. 2). However, our damping approach wasn’t perfect for a wide range of frequencies. Overall, as it is known by other work that the calculations done with the DG method can be accelerated, this paper paves the way for detailed vibration studies with lower computational costs compared to the often-used finite element method. We invite you to read our full paper to dive deeper into our methodology and findings.
Figure. 2 Mobility of scaled lightweight-wooden structure for the center excitation configuration with blue lines represent numerical results and black lines represent experimental results.


